Expedition
What?
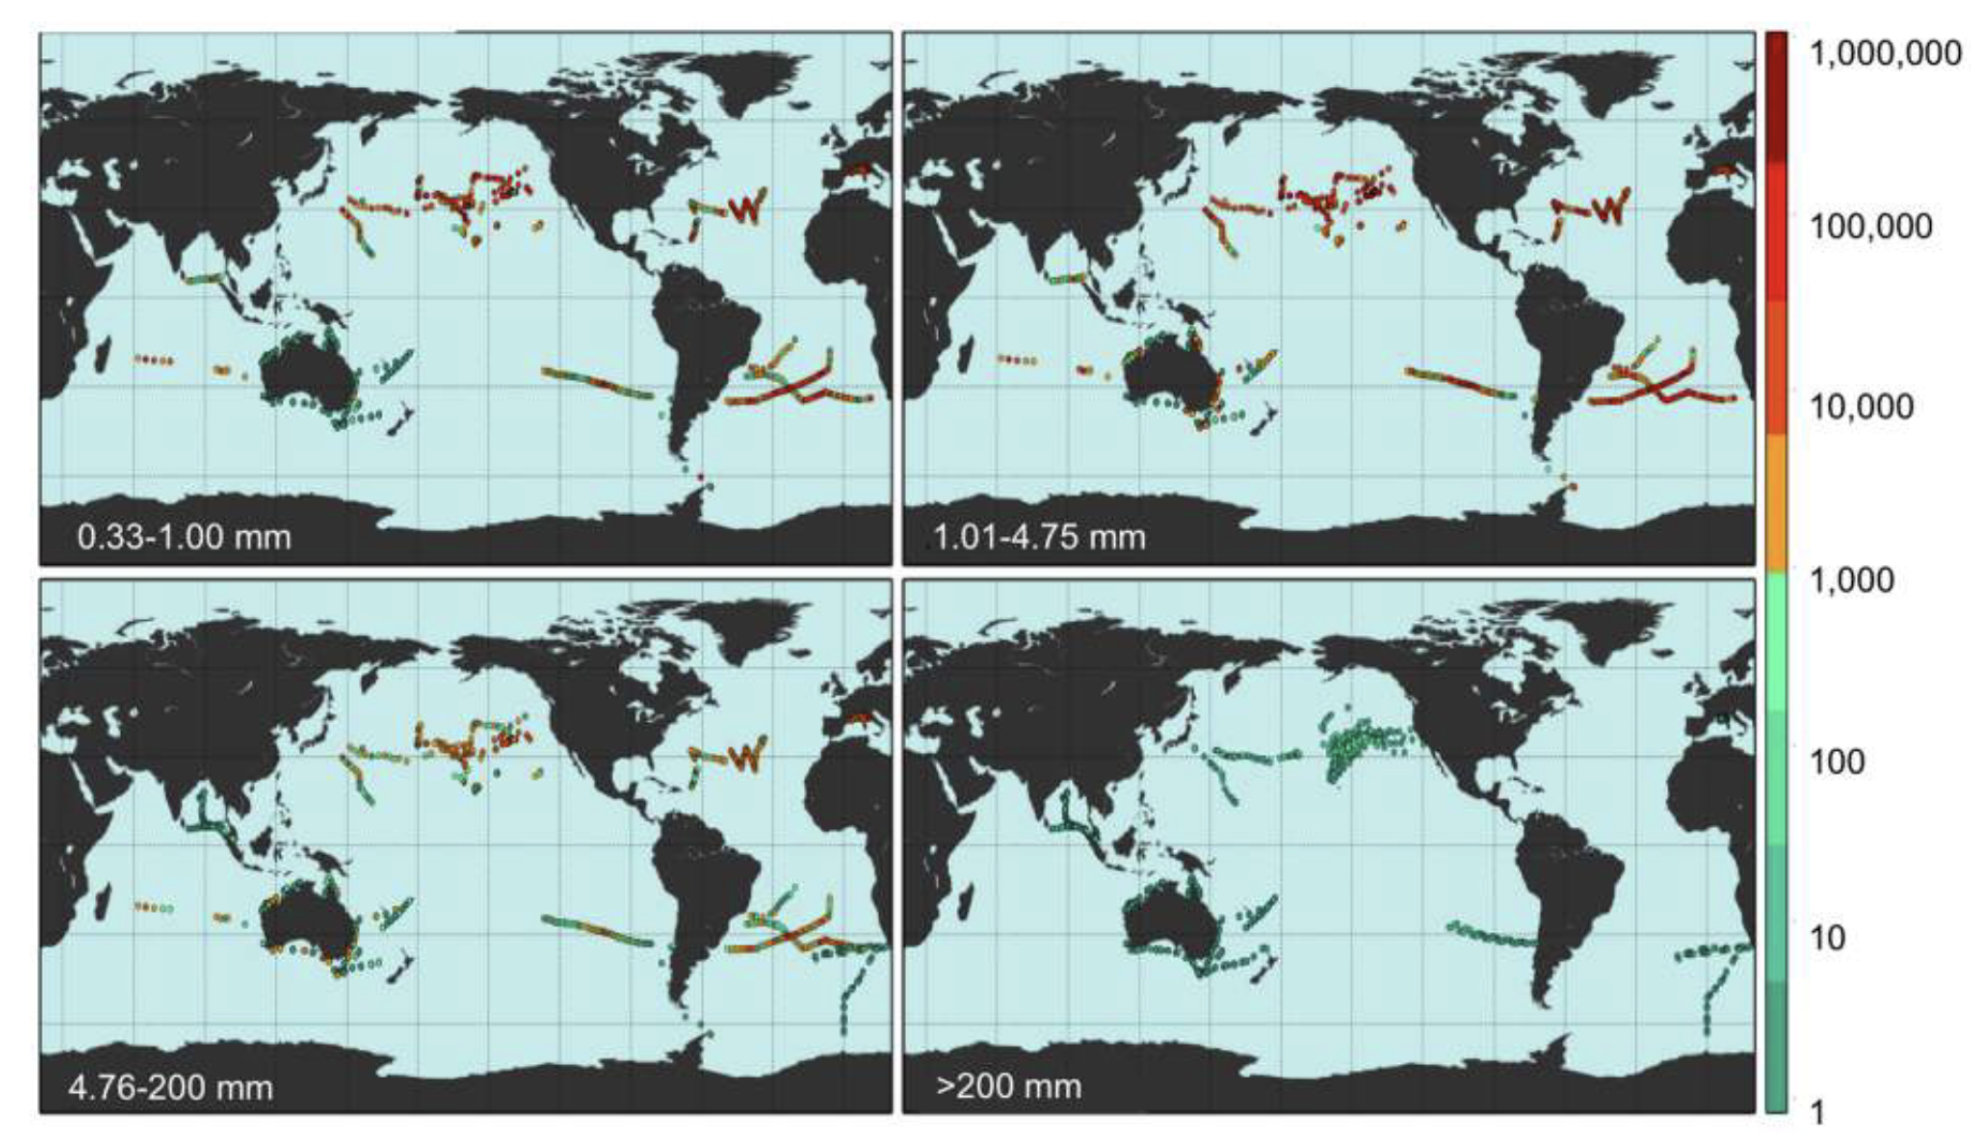
While plastic polution in the the world's oceans is a very well known topic, data on the abundance of plastic in the ocean is lacking. Collecting data on a specific number of plastic items has been proven very challenging. Below is an estiamte of the total number of plastic particles floating in the world's oceans. This data is from 24 expeditions between 2007 and 2013. These expeditions traveled all five sub-tropical gyres, coastal Australia, the Bay of Bengal, and the Mediterranean Sea. The data was colleceted using surface net tows as well as visual survey transects of large plastic debris.
How?
This data suggests that there are more than five trillion plastic pieces weighing over 250,000 tons in our world's oceans. The data, along with an oceanographic model of floating debris dispersal, and correcting for wind driven vertical mixing effects, it is estimated that this number is very close to correct. When comparing between four size classes, two microplastic <4.75mm and meso- and macroplastic >4,75mm, a tremendous loss of microplastics is observed from the sea surface compared to expected rates. This suggests that there are mechanisms at play that remove <4.75mm plastic particles from the ocean surface.
Source: Semantic Scholar
The Data
| Size Class | NP | NA | SP | SA | IO | MED | Total |
|---|---|---|---|---|---|---|---|
| 0.33-1.00 mm | 68.8 | 32.4 | 17.6 | 10.6 | 45.5 | 8.5 | 183 |
| 1.01-4.75 mm | 116 | 53.2 | 26.9 | 16.7 | 74.9 | 14.6 | 302 |
| 4.76-200 mm | 13.2 | 7.3 | 4.4 | 2.4 | 9.2 | 1.6 | 38.1 |
| >200 mm | 0.3 | 0.2 | 0.1 | 0.05 | 0.2 | 0.04 | 0.9 |
| Total | 199 | 93 | 49.1 | 29.7 | 130 | 24.7 | 525 |
|
Estimated total count (n x 1010 pieces) of plastic in the North Pacific (NP), North Atlantic (NA), South Pacific (SP), South Atlantic (SA), Indian Ocean (10), Mediterranean Sea (MED), and the global ocean (Total). Estimates were calculated after correcting for vertical distribution of microplastics.
Data from Semantic Scholar Data Table |
|||||||